plotly cdn版本生成chart
n5321 | 2025年10月18日 08:34
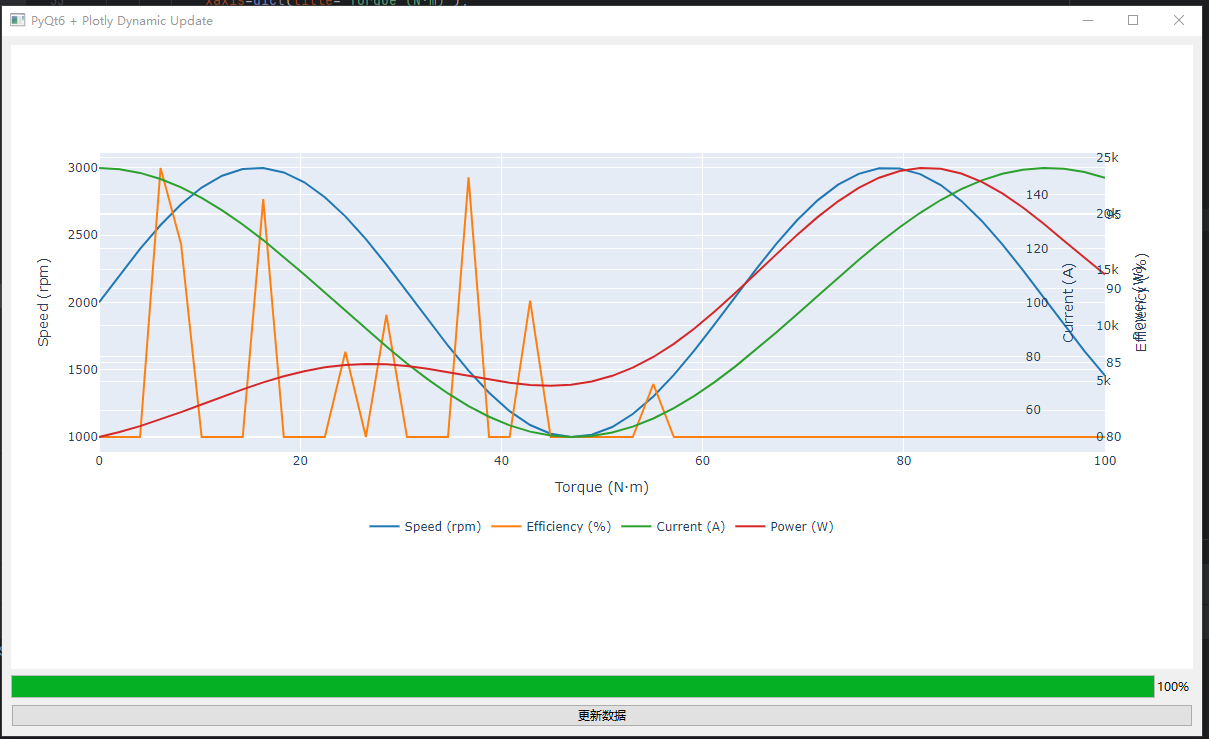
plotly本质上还是js!在desktop生成chart的时候确实是太慢了!效果:

价值是提供了交互式的chart!能够实线highcharts一样的效果,但是背后都是web front page!但是又没有浏览器摆在前面,比在chrome里面debug还烦些。
这个cdn版本写起来简单一点,但是加载时间要等几秒钟,太烦了!
要改用local js,居然是个麻烦事。
import sys
import numpy as np
from PyQt6.QtWidgets import QApplication, QMainWindow, QVBoxLayout, QWidget, QPushButton, QProgressBar
from PyQt6.QtWebEngineWidgets import QWebEngineView
from PyQt6.QtCore import pyqtSlot
import plotly.graph_objects as go

class PlotlyGuiDemo(QMainWindow):
    def __init__(self):
        super().__init__()
        self.setWindowTitle("PyQt6 + Plotly Dynamic Update")
        self.resize(1200, 700)

        # --- 主布局 ---
        central_widget = QWidget()
        self.setCentralWidget(central_widget)
        layout = QVBoxLayout(central_widget)

        # --- 浏览器控件 ---
        self.web_view = QWebEngineView()
        layout.addWidget(self.web_view)

        # --- 进度条 ---
        self.progress = QProgressBar()
        self.progress.setMaximum(100)
        layout.addWidget(self.progress)

        # --- 更新按钮 ---
        self.update_btn = QPushButton("更新数据")
        layout.addWidget(self.update_btn)
        self.update_btn.clicked.connect(self.update_plot)

        # --- 初始化数据 ---
        self.n_points = 50
        self.torque = np.linspace(0, 100, self.n_points)
        self.speed = np.sin(self.torque/10)*1000 + 2000
        self.current = np.cos(self.torque/15)*50 + 100
        self.power = self.speed * self.torque / 10
        self.efficiency = np.clip(np.random.rand(self.n_points)*100, 80, 100)

        # --- 创建 Plotly Figure ---
        self.fig = go.Figure()

        # 多 Y 轴 traces
        self.speed_trace = go.Scatter(x=self.torque, y=self.speed, name='Speed (rpm)', line=dict(color='#1f77b4'))
        self.efficiency_trace = go.Scatter(x=self.torque, y=self.efficiency, name='Efficiency (%)', line=dict(color='#ff7f0e'), yaxis='y2')
        self.current_trace = go.Scatter(x=self.torque, y=self.current, name='Current (A)', line=dict(color='#2ca02c'), yaxis='y3')
        self.power_trace = go.Scatter(x=self.torque, y=self.power, name='Power (W)', line=dict(color='#d62728'), yaxis='y4')

        for trace in [self.speed_trace, self.efficiency_trace, self.current_trace, self.power_trace]:
            self.fig.add_trace(trace)

        # 布局配置多 Y 轴
        self.fig.update_layout(
            xaxis=dict(title='Torque (N·m)'),
            yaxis=dict(title='Speed (rpm)', side='left'),
            yaxis2=dict(title='Efficiency (%)', overlaying='y', side='right', anchor='x'),
            yaxis3=dict(title='Current (A)', overlaying='y', side='right', anchor='free', position=0.92),
            yaxis4=dict(title='Power (W)', overlaying='y', side='right', anchor='free', position=0.99),
            legend=dict(orientation='h', yanchor="top", y=-0.2, xanchor="center", x=0.5),
            height=500
        )

        # --- 浏览器控件加载 HTML ---
        self.web_view.loadProgress.connect(self.progress.setValue)
        self.web_view.loadFinished.connect(self.on_load_finished)
        self.load_figure()

    def load_figure(self):
        # 第一次加载 HTML
        html = self.fig.to_html(include_plotlyjs='cdn', full_html=True)
        self.web_view.setHtml(html)

    @pyqtSlot(bool)
    def on_load_finished(self, ok):
        if ok:
            self.progress.setValue(100)
            print("图表加载完成!")
        else:
            print("图表加载失败!")

    def update_plot(self):
        # 模拟新数据
        self.speed = np.sin(self.torque/10 + np.random.rand())*1000 + 2000
        self.efficiency = np.clip(np.random.rand(self.n_points)*100, 80, 100)
        self.current = np.cos(self.torque/15 + np.random.rand())*50 + 100
        self.power = self.speed * self.torque / 10


        # 只更新 trace
        self.fig.data[0].y = self.speed
        self.fig.data[1].y = self.efficiency
        self.fig.data[2].y = self.current
        self.fig.data[3].y = self.power

        # 刷新浏览器控件(只生成 HTML,不重新生成 plotly.js)
        html = self.fig.to_html(include_plotlyjs=False, full_html=False)
        self.web_view.setHtml(html)


if __name__ == "__main__":
    app = QApplication(sys.argv)
    window = PlotlyGuiDemo()
    window.show()
  sys.exit(app.exec())
import sys
import os
import json
import numpy as np
from PyQt6.QtWidgets import QApplication, QMainWindow, QVBoxLayout, QWidget, QPushButton, QProgressBar
from PyQt6.QtWebEngineWidgets import QWebEngineView
from PyQt6.QtCore import pyqtSlot, QUrl
import plotly.graph_objects as go  # <--- 就是在这里添加缺失的导入

# 开启远程调试端口 (用于排查问题)
# 运行此脚本后, 在 Chrome/Edge 浏览器中打开 http://localhost:9223 即可看到开发者工具
os.environ['QTWEBENGINE_REMOTE_DEBUGGING'] = "9223"


class PlotlyGuiDemo(QMainWindow):
    def __init__(self):
        super().__init__()
        self.setWindowTitle("PyQt6 + Plotly Dynamic Update (已修正)")
        self.resize(1200, 700)

        central_widget = QWidget()
        self.setCentralWidget(central_widget)
        layout = QVBoxLayout(central_widget)

        self.web_view = QWebEngineView()
        layout.addWidget(self.web_view)

        self.progress = QProgressBar()
        self.progress.setMaximum(100)
        layout.addWidget(self.progress)

        self.update_btn = QPushButton("更新数据")
        layout.addWidget(self.update_btn)
        self.update_btn.clicked.connect(self.update_plot)

        self.n_points = 50
        self.torque = np.linspace(0, 100, self.n_points)
        self.speed = np.sin(self.torque / 10) * 1000 + 2000
        self.current = np.cos(self.torque / 15) * 50 + 100
        self.power = self.speed * self.torque / 10
        self.efficiency = np.clip(np.random.rand(self.n_points) * 100, 80, 100)

        # 现在 Python 认识 go 是什么了
        self.fig = go.Figure()

        self.fig.add_trace(go.Scatter(x=self.torque, y=self.speed, name='Speed (rpm)'))
        self.fig.add_trace(go.Scatter(x=self.torque, y=self.efficiency, name='Efficiency (%)', yaxis='y2'))
        self.fig.add_trace(go.Scatter(x=self.torque, y=self.current, name='Current (A)', yaxis='y3'))
        self.fig.add_trace(go.Scatter(x=self.torque, y=self.power, name='Power (W)', yaxis='y4'))

        self.fig.update_layout(
            xaxis=dict(title='Torque (N·m)'),
            yaxis=dict(title='Speed (rpm)', side='left', color='#1f77b4'),
            yaxis2=dict(title='Efficiency (%)', overlaying='y', side='right', anchor='x', color='#ff7f0e'),
            yaxis3=dict(title='Current (A)', overlaying='y', side='right', anchor='free', position=0.92,
                        color='#2ca02c'),
            yaxis4=dict(title='Power (W)', overlaying='y', side='right', anchor='free', position=0.99, color='#d62728'),
            legend=dict(orientation='h', yanchor="top", y=-0.2, xanchor="center", x=0.5),
            height=500
        )

        self.web_view.loadProgress.connect(self.progress.setValue)
        self.web_view.loadFinished.connect(self.on_load_finished)
        self.load_figure()

    def load_figure(self):
        plotly_cdn = "https://cdn.plot.ly/plotly-latest.min.js"

        fig_data_json = json.dumps(self.fig.to_dict()['data'])
        fig_layout_json = json.dumps(self.fig.to_dict()['layout'])

        html = f"""
        <html>
          <head>
            <meta charset="utf-8" />
            <script src="{plotly_cdn}"></script>
          </head>
          <body>
            <div id="plotly-div" style="width:100%; height:100%;"></div>
            <script>
              var fig_data = {fig_data_json};
              var fig_layout = {fig_layout_json};
              Plotly.newPlot('plotly-div', fig_data, fig_layout, {{responsive: true}});
            </script>
          </body>
        </html>
        """
        self.web_view.setHtml(html)

    @pyqtSlot(bool)
    def on_load_finished(self, ok):
        if ok:
            self.progress.setValue(100)
            print("图表加载完成!")
        else:
            print("图表加载失败!")

    def update_plot(self):
        self.speed = np.sin(self.torque / 10 + np.random.rand()) * 1000 + 2000
        self.efficiency = np.clip(np.random.rand(self.n_points) * 100, 80, 100)
        self.current = np.cos(self.torque / 15 + np.random.rand()) * 50 + 100
        self.power = self.speed * self.torque / 10

        new_data_y = [
            self.speed.tolist(),
            self.efficiency.tolist(),
            self.current.tolist(),
            self.power.tolist()
        ]

        js_code = f"Plotly.restyle('plotly-div', {{'y': {json.dumps(new_data_y)}}}, [0, 1, 2, 3]);"
        self.web_view.page().runJavaScript(js_code)


if __name__ == "__main__":
    app = QApplication(sys.argv)
    window = PlotlyGuiDemo()
    window.show()
    sys.exit(app.exec())