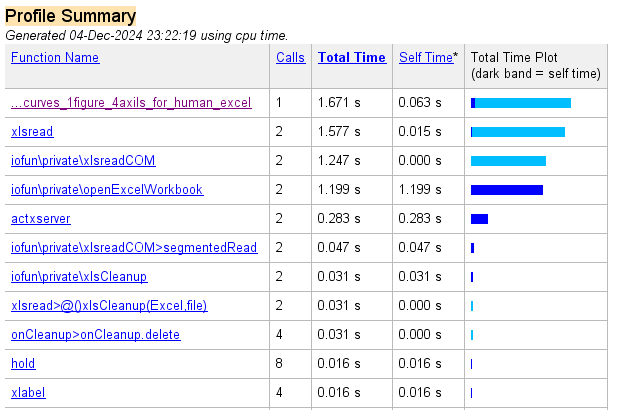
review Code
n5321 | 2024年12月4日 23:11
Compare_curves_1figure_4axils_for_human_excel.m
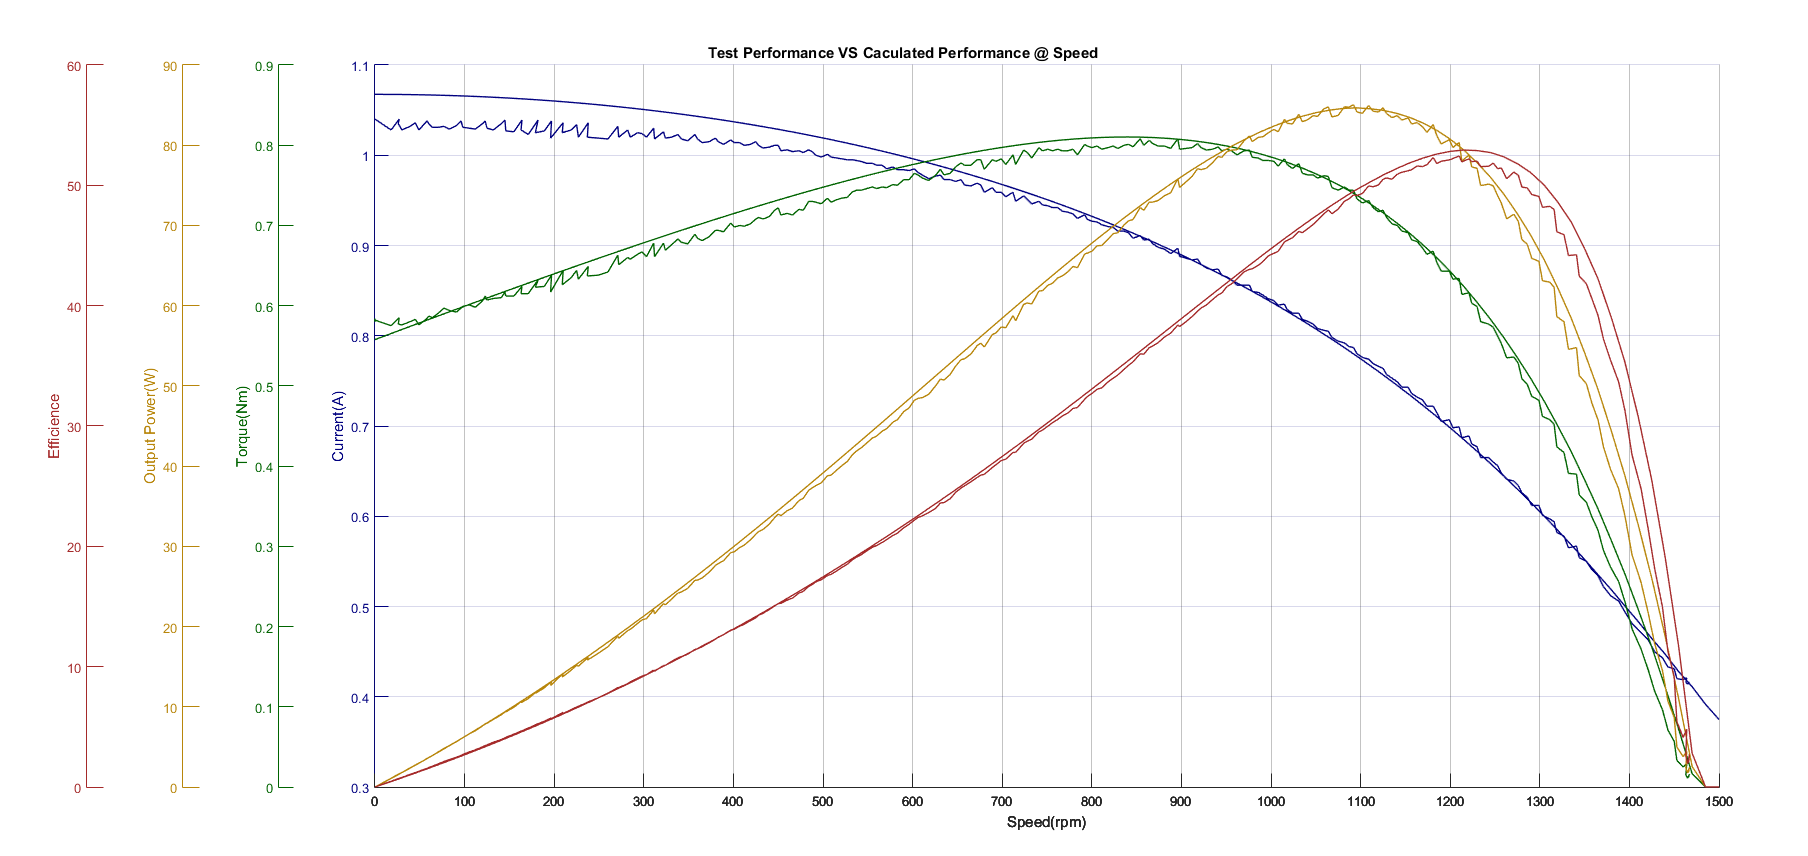
run以后获得结果
编程的本质问题是数据结构问题!
比如这个代码里面,对于数据结构的处理就是最初级的一个处理。只解决当下的一个问题,没有拓展,没有维护性!
正常来说,这个数据应该要丢到一个db里面!
存在的几个问题:
- 左侧multiaxes的标尺不齐!
- 文件依赖关系很容易出问题('D:\experiment\Demos\80W.xls','test','A2:H263')!用django的文件依赖方式就会好很多。
- BLDC电机习惯用torque做X轴。
- 缺highchart那种dynamic效果
- 对于一些关键点的数据,缺乏marker!
- 数据用csv格式存肯定更好,会有更好的performance!
- 关键的点是希望在鼠标挪过去的时候,能够看到数值,这是工程师关注的关键内容。
- 表格下方可以考虑做一个类似测功机出图工具的表单,把重要的一些极值列出来。在这里应该可以出一个小table,罗列数据对比的结果。
- matlab的价值是可以出3D图,以前是考虑过这个问题的!如何应用3D图的可视化效果!!
- 代码的重复率太高,完全可以抽象到一个更高的程度!更好控制,更好地效果,更好维护!
这个图的本质价值是仿真与测工一致性的对比。
clear
clc
%% 自excel表中导入原始测功数据.
[~, ~, raw] = xlsread('D:\experiment\Demos\80W.xls','test','A2:H263');
test_curve = reshape([raw{:}],size(raw));
clearvars raw;
test_curve_size=size(test_curve);
% This is the actual test result of a motor.
%做demo,考虑图示效果,不用。
[~, ~, raw] = xlsread('D:\experiment\Demos\80W.xls','Calculate','A2:E102');
caculate_curve = reshape([raw{:}],size(raw));
caculate_curve_size=size(caculate_curve );
clearvars raw,
%%  对于实际测功曲线进行曲线拟合(曲线数据准备)
% 电流曲线用三阶多项式曲线拟合,获得表达式
fa=polyfit(test_curve(:,4),test_curve(:,1),3);
Ia1=polyval(fa,test_curve(:,4));
Current_rms=sqrt(mean(test_curve(:,1)-Ia1).^2);
str_current=strcat('Rmse of Current=',num2str(Current_rms));
%  扭力曲线
ft=polyfit(test_curve(:,4),test_curve(:,6),4);
Torq=polyval(ft,test_curve(:,4));
Torque_rms=sqrt(mean(test_curve(:,6)-Torq).^2);
str_torque=strcat('Rmse of Torque=',num2str(Torque_rms));
%  输出功率
Outputpower=Torq.*test_curve(:,4)./9.54929659;
Outputpower_rms=sqrt(mean(test_curve(:,5)-Outputpower).^2);
str_outputpower=strcat('Rmse of Power=',num2str(Outputpower_rms));
%  效率曲线,计算输出功率除以输入功率(设考虑功率因数为0.997)。
Input_power=220.*Ia1;
Eff_1=(Outputpower./Input_power).*100.*0.997;
Eff_rms=sqrt(mean(test_curve(:,7)-Eff_1).^2);
str_Eff=strcat('Rmse of EFf=',num2str(Eff_rms));
%% 绘图
% 定4个颜色
colors = [
        0 0 128
        0 100 0
        184 134 11
        165 42 42]./255
figure('Position',[50 100 1800 900],'Color',[1 1 1]);
%%定X轴
ax(1) = axes('Position',[0.225 0.15 0.7 0.75],'XLim',...
    [min(test_curve(:,4)) 1500],'LineWidth',...
    0.7,'XTick',[linspace(0,1500,16)],...
    'YTick',[],'Color','None','YColor','None');
hold on
xlabel('Speed(rpm)');
%% 画电流曲线
plot(test_curve(:,4),test_curve(:,1),caculate_curve(:,1),caculate_curve(:,2),'LineWidth',1, 'Color',colors(1,:));
grid
ax(2) = axes('Position',[0.225 0.15 0.7 0.75],...
   'XLim',[min(test_curve(:,4)) 1500],...
   'YLim',get(ax(1),'YLim'),...
   'LineWidth',0.7,...
   'XTick',[],...
   'YAxisLocation','Left',...
   'Color','None',...
   'XColor','None',...
   'YColor',colors(1,:)); hold on
ylabel('Current(A)')
grid
% text(1300,1,str_current,'color',colors(1,:),'FontSize',14);
% text(1300,1.025,str_torque,'color',colors(2,:),'FontSize',14);
% text(1300,1.05,str_outputpower,'color',colors(3,:),'FontSize',14);
% text(1300,1.075,str_Eff,'color',colors(4,:),'FontSize',14);


%% 画扭力曲线
ax(3) = axes('Position',[0.225 0.15 0.7 0.75],'XLim',...
    [min(test_curve(:,4)) 1500],'LineWidth',...
    0.7,'XTick',[linspace(0,1500,16)],...
    'YTick',[],'Color','None','YColor','None');
hold on
xlabel('Speed(rpm)');
plot(test_curve(:,4),test_curve(:,6),caculate_curve(:,1),caculate_curve(:,4),'LineWidth',1, 'Color',colors(2,:));
grid
ax(4) = axes('Position',[0.175 0.15 0.775 0.75],...
   'XLim',[min(test_curve(:,4)) 1500],...
   'YLim',get(ax(3),'YLim'),...
   'LineWidth',0.7,...
   'XTick',[],...
   'YAxisLocation','Left',...
   'Color','None',...
   'XColor','None',...
   'YColor',colors(2,:)); hold on
ylabel('Torque(Nm)')
%% 画输出功率曲线
ax(5) = axes('Position',[0.225 0.15 0.7 0.75],'XLim',...
    [min(test_curve(:,4)) 1500],'LineWidth',...
    0.7,'XTick',[linspace(0,1500,16)],...
    'YTick',[],'Color','None','YColor','None');
hold on
xlabel('Speed(rpm)');
plot(test_curve(:,4),test_curve(:,5),caculate_curve(:,1),caculate_curve(:,3),'LineWidth',1, 'Color',colors(3,:));
ax(6) = axes('Position',[0.125 0.15 0.85 0.75],...
   'XLim',[min(test_curve(:,4)) 1500],...
   'YLim',get(ax(5),'YLim'),...
   'LineWidth',0.7,...
   'XTick',[],...
   'YAxisLocation','Left',...
   'Color','None',...
   'XColor','None',...
   'YColor',colors(3,:)); hold on
ylabel('Output Power(W)')
%%  画效率曲线
ax(7) = axes('Position',[0.225 0.15 0.7 0.75],'XLim',...
    [min(test_curve(:,4)) 1500],'LineWidth',...
    0.7,'XTick',[linspace(0,1500,16)],...
    'YTick',[],'Color','None','YColor','None');
hold on
xlabel('Speed(rpm)');
plot(test_curve(:,4),test_curve(:,7),caculate_curve(:,1),caculate_curve(:,5),'LineWidth',1, 'Color',colors(4,:));
ax(8) = axes('Position',[0.075 0.15 0.85 0.75],...
   'XLim',[min(test_curve(:,4)) 1500],...
   'YLim',get(ax(7),'YLim'),...
   'LineWidth',0.7,...
   'XTick',[],...
   'YAxisLocation','Left',...
   'Color','None',...
   'XColor','None',...
   'YColor',colors(4,:)); hold on
ylabel('Efficience')
title('Test Performance VS Caculated Performance @ Speed');
用xlsread()确实是浪费了很多不必要的时间!